
What Happened With July 2026 CPI and Why Does It Matter for Crypto?
The July inflation report landed exactly in line with expectations, yet the setup around it left crypto in an awkward spot. Inflation is sticky, the labor market is weakening fast, and a minority of the Fed is arguing for a hike rather than a cut. The in-line print removed the immediate fear of a rate shock, but it did nothing to restore the rate-cut story that risk assets had been leaning on.
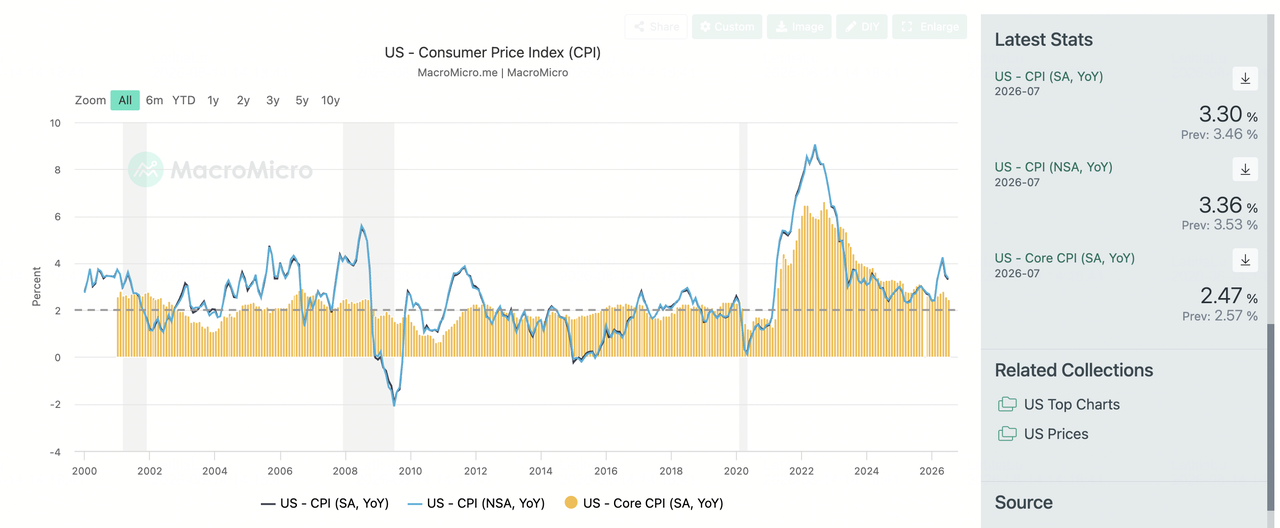
Source: MacroMicro
- Inflation cooled but stayed high. July headline CPI was 3.4% year over year, up 0.1% month over month, with core CPI at 2.5%, up 0.2%. Both matched expectations, but 3.4% remains well above the 2% target after climbing from 3.3% to a May high of 4.2%, showing how sticky the trend is.
- The labor market weakened sharply. July non-farm payrolls came in at negative 23,000 with unemployment at 4.1%, a sudden softening that complicates the inflation picture.
- The Fed is caught in a bind. The July 29 FOMC held rates at 3.50% to 3.75% in a 9-to-3 vote, with three members favoring a hike, driven by energy prices from Middle East conflict and tariff pass-through.
- The market stopped pricing recession-style cuts. The trade is no longer about the Fed easing into a downturn, which changes what actually drives crypto in August.
- ETF flows became the deciding variable. With the macro path stuck, the direction of major crypto in August now hinges on whether spot ETF inflows can stay positive.
July 2026 CPI and the Crypto Backdrop at a Glance
|
Item |
Detail |
What It Signals |
|
Headline CPI |
3.4% YoY, +0.1% MoM |
In line, but still far above the 2% target |
|
Core CPI |
2.5% YoY, +0.2% MoM |
Underlying pressure remains sticky |
|
July payrolls |
-23,000, unemployment 4.1% |
Sudden labor-market weakness |
|
July 29 FOMC |
Held at 3.50% to 3.75%, 9-to-3 vote |
Three members wanted a hike |
|
September hike odds |
Fell to about 34.7% from around 55% |
Rate-shock risk eased, not removed |
|
Deciding variable |
Spot ETF net flows |
Direction now hinges on flows, not the print |
The takeaway is that the in-line CPI is a neutral-to-slightly-positive "bad news is priced in" signal. It removed downside risk but supplied no upside momentum. What actually decides August is whether ETF inflows can stay positive, and right now those flows are coming in pulses rather than as a trend, with institutions still on the sidelines.
How Did Bitcoin, Ethereum, Solana, and HYPE React to July CPI?
The in-line print lowered hike odds to about 35%, opening a short-term technical rebound window for all four coins, but the mid-term drag from high real rates was left unresolved. Because CPI is a "downside-cleared" signal, its transmission strength depends on each coin's beta and capital structure, which is why the four split so clearly.
1. Bitcoin (BTC): The Highest-Certainty, ETF-Anchored Name
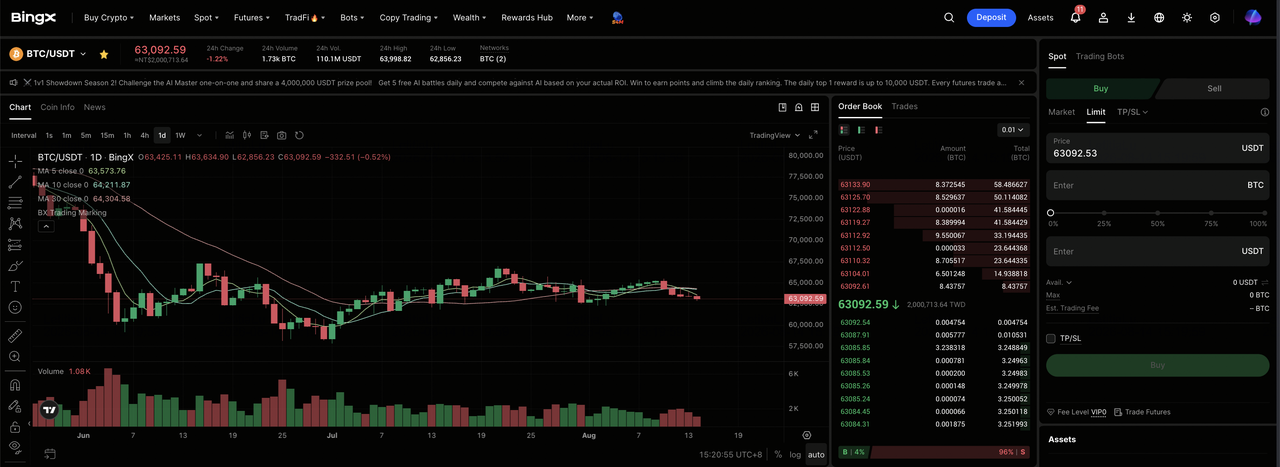
Bitcoin holds a core line of defense at $62,000 to $64,000, with an RSI near 44 that reads as slightly weak, and resistance at $64,567 and $67,172. It is relatively insensitive to CPI transmission, with direction driven mainly by Bticoin ETF buying, and it saw net inflows of $853.5 million in the week of August 7. Among the four, it offers the highest certainty and the strongest downside protection, with its direction resting on the September FOMC and ETF flows.
2. Ethereum (ETH): The Best Recovery Elasticity
Ethereum has the relatively strongest technical picture of the three large coins, with an RSI near 51 and $2,000 as the key threshold. It is more CPI-sensitive than Bitcoin, so falling hike odds directly improve its valuation outlook, and it led gains over the prior 30 days, though a shift to Ethereum ETF net outflows in early August weakened its elasticity. It shows the best recovery elasticity, with a smaller 90-day drawdown than BTC and momentum turning positive first, but if the Fed hikes in September its pullback could exceed Bitcoin's.
3. Solana (SOL): The High-Beta Risk-Appetite Gauge
Solana is ranging between $75 and $77, with support at $72 to $74 and resistance at $78 to $80. It is the most CPI-sensitive of the group and, as a high-beta name, rebounds fastest, leading on 7-day gains, but it lacks sustained spot-ETF buying, so its upside durability is weaker than BTC or ETH. It suits an aggressive allocation and works as a risk-appetite thermometer, with $78 to $80 as the directional dividing line; if the Fed hikes, its pullback risk is relatively large.
4. Hyperliquid (HYPE): The Fundamentals-Driven Outlier
Hyperliquid (HYPE) is testing resistance at $57, with support at $52 and $46 to $47. It has the weakest CPI macro transmission of the four, with its trajectory driven by fundamentals: whale buying of $7.29 million and the launch of the xStocks tokenized-equity platform. It was the only one of the four with a positive 90-day return, confirming the pattern that when macro conditions weigh on large-cap coins, projects with real business and cash flow can trade independently. It follows a growth-stock logic more than a macro one, but its small market-cap liquidity, violent volatility, and reliance on delivering growth to justify a high valuation make it unsuitable as a core holding.
Major Coins Price Movement Overview
|
Coin |
Price (USD) |
7d |
30d |
90d |
CPI Sensitivity |
Core Attribute |
|
BTC |
$63,736 |
-1.65% |
0.0166 |
-20.99% |
Low |
ETF-anchored |
|
ETH |
$1,891 |
-1.06% |
0.0588 |
-16.22% |
Medium-high |
Best recovery elasticity |
|
SOL |
$76.18 |
0.0323 |
0.0121 |
-16.62% |
High |
High beta |
|
HYPE |
$56.94 |
0.0157 |
-10.51% |
0.2413 |
Lowest |
Fundamentals-driven |
The relief transmits by descending beta: SOL and ETH show more elasticity than BTC, while HYPE is largely desensitized to the macro signal. The 90-day divergence reveals capital rotating toward projects with real businesses. On certainty, the ranking is BTC over ETH over SOL over HYPE.
Why Did the In-Line CPI Only Steady Crypto? 4 Forces Behind the Move
The muted reaction came from more than the print itself. Four separate channels are pulling in different directions and different timeframes, and each one shapes how far the relief can travel.
- The rate-expectations channel opened a short-term window. With CPI in line, September hike odds fell from around 55% to about 35%, easing the risk of a surprise hike, pressuring Treasury yields and the dollar in the short term, and giving BTC and ETH breathing room as risk appetite repaired at the margin.
- The real-rate channel keeps a mid-term lid on prices. With inflation still at 3.4%, the Fed cannot easily cut, nominal rates stay high, real rates stay elevated, and the opportunity cost of holding non-yielding assets compresses their valuation anchor.
- The liquidity and ETF channel is the structural swing factor. High rates keep liquidity tight and institutions cautious, so ETF money moves in pulses that feed directly into spot buying, with IBIT accounting for roughly 70% to 81% of ETF flows and concentrating pricing power heavily.
- The safe-haven narrative is fracturing. High inflation is making the market re-examine Bitcoin's "inflation hedge" story, and under high real rates BTC behaves more like a risk asset than like gold, diverting some capital toward gold and silver.
For investors, the interaction matters more than any single channel. The first channel offers a short-term rebound window, the second and third impose a mid-term ceiling, and the fourth flags narrative risk. Major coins are stuck in a "bullish short-term, bearish longer-term" tug-of-war, and absent a genuine Fed pivot or sustained large ETF inflows, the broad trend is hard to change.
How Does the Same CPI Print Move the Dollar, Gold, and Crypto Differently?
All three sit on the same "Fed rate-expectations" trunk, but they respond through different channels, and the divergence reveals the market's real ordering of capital when hike odds fall.
1. The Dollar (DXY): Short-Term Pressure, Mid-Term Support
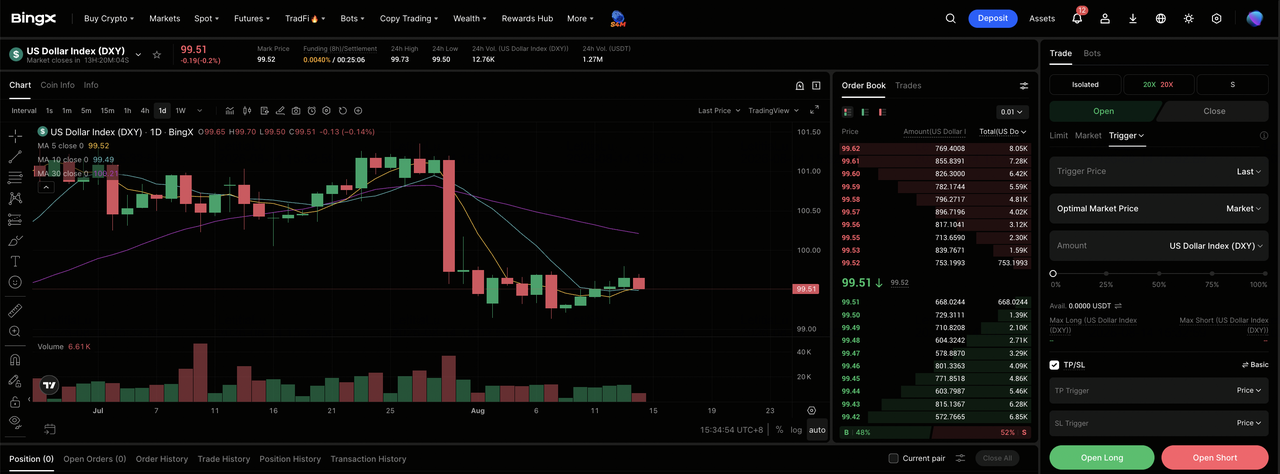
With CPI in line rather than above expectations, September hike odds fell from around 55% to about 35%, Treasury yields eased in the short term, the dollar's carry appeal dropped, and the US dollar index softened, matching the logic that cooling hike bets pressure the dollar. Short-term dollar weakness is the clearest marginal positive from this print for risk assets, including crypto. But the mid-term support for the dollar remains, because sticky inflation keeps the Fed from turning to easing, and elevated real rates keep a floor under the dollar.
2. Gold: The Biggest Winner From the Print
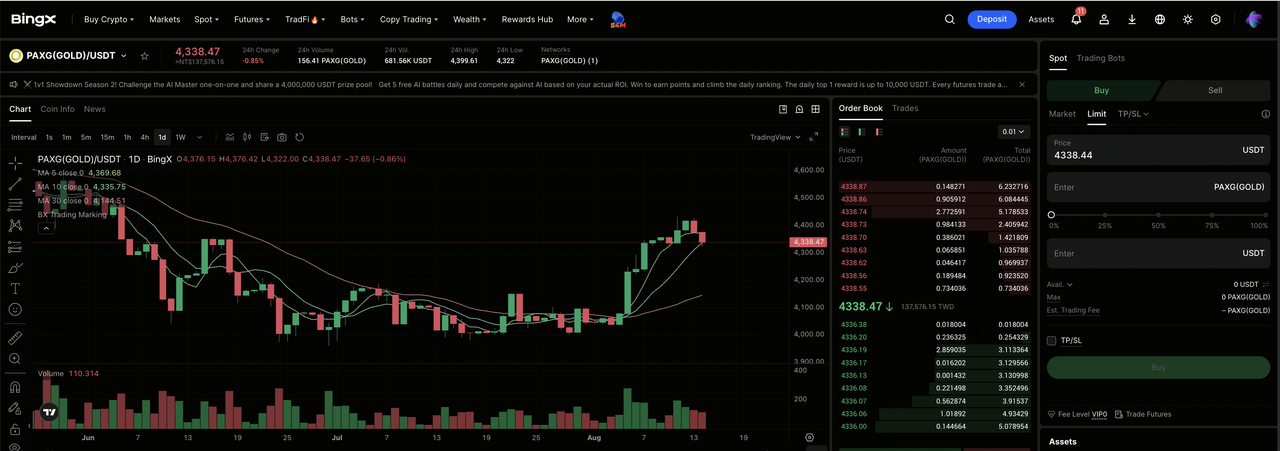
Gold benefits from two reinforcing chains and one narrative chain. As hike odds fall, nominal yields ease, real yields fall, and the opportunity cost of holding non-yielding gold drops, supporting the price. At the same time, a softer dollar makes dollar-priced gold cheaper for non-US buyers, lifting demand, which resonates with the real-rate chain. In a stagflationary mix of high inflation and collapsing employment, the market seeks a true safe-haven asset and diverts capital from BTC into gold. With inflation cooling and the dollar and real yields easing together, gold is positioned to challenge $4,500, though it fell back after approaching technical resistance near $4,387 at the 100-day moving average and closed lower twice in August, showing that upside resistance is real.
Read More: Gold Price Outlook 2026: Can Rate Cuts and Central-Bank Buying Push Gold Above $5,000?
3. Crypto: A Weak Rebound Without Momentum
Facing the same drop in hike odds, gold can keep rising while BTC only rebounds modestly. In a stagflationary environment, capital's safe-haven choice is physical gold first, which is why gold is the biggest beneficiary of this CPI and crypto is left with a weak, momentum-light bounce.
|
Asset |
Post-CPI Move |
Core Driver |
Relative to Major Coins |
|
Gold |
Rose toward $4,380, a 10-week high |
Falling real rates plus safe-haven plus soft dollar |
True safe-haven, diverts crypto capital |
|
Dollar (DXY) |
Short-term pressure |
Cooling hike bets |
Weak dollar helps crypto short-term |
|
BTC / major coins |
Modest rebound, weak momentum |
Marginal risk-appetite repair |
High-beta risk asset |
The core read is that all three share the "Fed rate-expectations" trunk, but the directional split reveals the real ordering of capital: when hike odds fall, gold as the true safe-haven ranks first, a weaker dollar helps crypto, and crypto itself manages only a weak rebound.
What Are Institutions Saying After the July CPI Print?
Sell-side desks are broadly cautious, but their words and their money disagree, which is itself the key signal.
|
Institution |
View and Stance |
|
J.P. Morgan |
Raised its base case from "on hold through 2026" to a 25 bps hike in September, citing slow supply-chain recovery and inflation expectations that have not cooled |
|
Charles Schwab |
Says the 9-to-3 split vote at the July FOMC adds pressure toward a September hike |
|
B2BROKER (Azizov) |
Calls this month's CPI "a problem but not a disaster" for risk assets, more likely to mean higher yields, a stronger dollar, and larger crypto volatility; earlier noted that real yields and the dollar are both working against Bitcoin, making a clean breakout unlikely |
|
BlackRock (via IBIT) |
Kept adding through early August, buying about $111 million of BTC in a single day on August 3 |
- The sell-side lean is hawkish. J.P. Morgan flipping to a September hike and Schwab flagging the split vote both point to rising, not falling, rate risk.
- Actions and words diverge. Institutions "voting with their feet" through ETF inflows while "speaking hawkishly" shows they are unwilling to size up at highs but also unwilling to leave, mostly trading the range.
- One week of inflows is not a bull market. Investors should not read a single week of ETF inflows as the start of a new uptrend, given how pulse-like and concentrated the flows are.
4 Major Risks Every Investor Must Watch After the CPI Print
The in-line print eased the immediate threat, but it left several risks that will decide whether the rebound holds.
- September hike tail risk is still alive. Odds sit near 35%, but a deterioration in energy or the Middle East could push them back up quickly, and a hike would hit major coins with a fresh wave of selling pressure.
- Stagflation weakens the inflation-hedge narrative. If BTC keeps behaving as a risk asset, its valuation anchor stays compressed under high real rates.
- ETF flows are fragile. They depend heavily on the single IBIT channel, already turned to a net outflow on August 11, and are still down roughly $4.5 billion net year to date.
- Political and regulatory uncertainty. Trump's pressure on the Fed and delays to the CLARITY Act could deliver non-linear shocks.
Near-term, the key watch points are daily ETF flows through August, the 10-year Treasury yield and the dollar index, the August CPI on September 11 as the most important inflation read before the FOMC, and the September 16 FOMC rate decision as the core event for the mid-term direction.
July 2026 CPI: Does the In-Line Print Really Change the Trend for Crypto?
The July CPI cleared some near-term downside without creating a strong upside catalyst, which helps explain why major cryptocurrencies stabilized rather than rallied. The relief comes from lower rate-hike expectations and a ceiling on real yields, but only the first can quickly support higher prices. With inflation still at 3.4%, real rates remain restrictive, so the next leg depends more on ETF flows and Fed expectations than on CPI alone.
A sustained ETF inflow trend or a more dovish Fed would strengthen the bullish case, while renewed energy inflation or a hawkish September FOMC could restart the pullback, especially in higher-beta assets. Until the August CPI on September 11 and the September 16 FOMC, the setup favors range trading rather than chasing momentum, with BTC and ETH as the core and smaller SOL and HYPE exposure. In terms of conviction, BTC ranks first, followed by ETH, SOL, and HYPE.
Risk Reminder: This article is for educational and informational purposes only and does not constitute investment advice. Cryptocurrency and equity-linked products are volatile and carry risk. Always conduct your own research before trading.
Related Reading
- June 2026 US CPI Cools to 3.5%: What the Inflation Drop Means for Stocks, Gold, and Crypto
- July 2026 Fed Rate Decision: What the Hawkish FOMC Means for Stocks, Gold, and Interest Rates
- Gold Price Outlook 2026: Can Rate Cuts and Central-Bank Buying Push Gold Above $5,000?
- SpaceX (SPCX) Price Prediction 2026: $227 Street-High AI Fusion or Trillion-Dollar Valuation Bubble?
- SpaceX (SPCX) Lockup Expiry on August 6: Key Risks and What Investors Need to Know
FAQs on the July 2026 CPI and Major Crypto
1. Was the July 2026 CPI good or bad for crypto?
It was neutral-to-slightly-positive. At 3.4% headline and 2.5% core, both in line with expectations, the print removed the risk of a surprise hike but supplied no upside momentum, since 3.4% is still well above the 2% target. It cleared downside rather than adding upside.
2. Why did the major coins react so differently?
The relief transmitted by descending beta. SOL, as the highest-beta name, rebounded fastest but lacks sustained ETF buying; ETH showed the best recovery elasticity; BTC was the most stable and ETF-anchored; and HYPE, driven by fundamentals rather than macro, was the only one with a positive 90-day return.
3. What now decides the direction of crypto in August?
Spot ETF flows. With the macro path stuck between sticky inflation and a weak labor market, the direction hinges on whether inflows stay positive. They are currently pulse-like rather than trending, concentrated in IBIT at roughly 70% to 81% of flows, and already turned to an outflow on August 11.
4. Why did gold benefit more than Bitcoin from the same print?
In a stagflationary mix of high inflation and collapsing employment,the capital's safe-haven choice is physical gold first. Facing the same drop in hike odds, gold can keep rising toward $4,500 while BTC only rebounds modestly, because under high real rates BTC behaves more like a risk asset than like gold.
5. When is the next major test?
The August CPI on September 11 is the most important inflation read before the Fed meets, and the September 16 FOMC rate decision is the core event for the mid-term direction. Daily ETF flows, the 10-year yield, and the dollar index are the near-term signals in between.
