
GE Aerospace (GE) entered late July 2026 having beaten expectations and lost ground anyway, for the third earnings report running. On July 16, the company reported second-quarter adjusted revenue of $12.6 billion, up 24%, and adjusted EPS of $2.02, up 22% and ahead of the $1.86 consensus, then raised full-year guidance across revenue, operating profit, EPS and free cash flow. The stock fell roughly 4% to 5% in the sessions that followed, trading near $360 after touching a 52-week high of $382.97 before the release.
The quarter itself was close to a clean sweep. Free cash flow rose 43% to $3.0 billion with conversion above 140%, commercial services revenue grew 26% on record internal shop visit output, and LEAP deliveries rose 24% in the quarter. What the market fixed on instead was the order line. Total orders grew 17% to $16.5 billion, a sharp deceleration from the 87% surge reported in Q1, and margins fell 130 basis points to 21.7% on higher installed engine deliveries, GE9X production ramp investment and inflation.
The GE stock forecast for 2026 now centers on two competing views:
- The visibility case: Bulls expect a backlog exceeding $210 billion, including $170 billion in commercial services, plus 95% visibility into Q3 spare parts revenue, to convert into years of predictable aftermarket earnings, with analyst targets running as high as $455.
- The valuation case: Bears see order growth decelerating hard, margins compressing on delivery mix, and a stock at roughly 46 times forward earnings that already prices the conversion it has not yet delivered.
This guide breaks down the GE stock forecast, 2026 price scenarios, key risks, and research from Jefferies, RBC Capital and the broader Street, drawing on the July 16 earnings release and the Q2 investor call, plus how to trade GE stock futures on BingX TradFi with USDT collateral.
Top 5 Things for GE Aerospace Investors to Know in July 2026
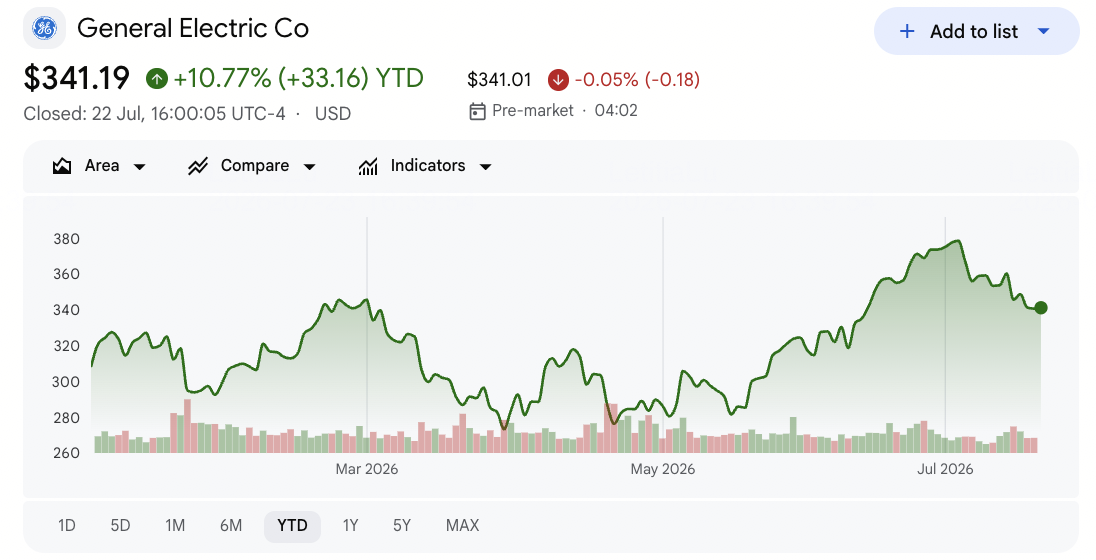
- Q2 adjusted EPS of $2.02 beat the $1.86 consensus by 8.6%: Adjusted revenue of $12.6 billion grew 24% and topped forecasts by nearly 7%, marking the fifth consecutive quarter of at least 20% revenue expansion. GAAP profit from continuing operations reached $2.41 billion, or $2.30 per share.
- Guidance was raised on every major line: Adjusted EPS moved to $7.65 to $7.85 from $7.10 to $7.40, operating profit to $10.55 to $10.75 billion from $9.85 to $10.25 billion, free cash flow to $8.9 to $9.2 billion, and revenue growth from low double digits to high teens.
- Order growth decelerated from 87% to 17%: Total orders reached $16.5 billion, up 17% with commercial orders up 18%, against the 87% surge posted in Q1. This deceleration, not the results, is what sent the stock lower.
- Margins fell 130 basis points to 21.7%: The compression came from higher installed engine deliveries, GE9X production ramp investment ahead of the Boeing 777-9, and inflation, even as operating profit grew 18% to $2.7 billion.
- Free cash flow rose 43% to $3.0 billion: Conversion exceeded 140%, funding $4.22 billion of share repurchases during the quarter, with the raised $9 billion-plus full-year cash flow target already exceeding the original 2028 goal set a year ago.
What Is GE Aerospace (GE)?

GE Aerospace is the focused aviation business that emerged from General Electric's 2024 breakup, and it is now a pure-play jet engine manufacturer and aftermarket services provider. It operates through two segments: Commercial Engines & Services, which grew sales 27% in the quarter, and Defense & Propulsion Technologies, which grew 16%.
The economics are aftermarket economics. Engines are sold at thin or negative margin and earn their return across decades of spare parts and shop visits, which is why a $170 billion commercial services backlog inside a total backlog exceeding $210 billion matters more than any single quarter of deliveries. CFO Rahul Ghai confirmed 95% visibility into third-quarter spare parts revenue, and roughly two-thirds of projected 2026 shop visit engines were already off wing. Under CEO Larry Culp, the FLIGHT DECK operating system has cut production lead times for critical engine parts by 60%, with CFM56 final assembly reduced by 50%. Recent commercial wins include more than 300 LEAP-1A engines for American Airlines, 300 GEnx engines for United and 60 for Delta, while a China order for 200 Boeing aircraft is expected to require 400 to 450 GE engines. The company has committed roughly $1 billion of additional U.S. investment, including $200 million to ramp LEAP capacity and $275 million for defense engine production.
GE Aerospace (GE) Q2 2026 Earnings: What Drove the Beat and the Guidance Raise
- Commercial services carried the quarter. Services revenue grew 26% with record internal shop visit output and spare parts revenue up more than 25%, the highest-margin revenue GE generates.
- LEAP deliveries accelerated. Production deliveries rose 24% in Q2 and 41% across the first half, with management lifting full-year LEAP delivery growth guidance to high teens from a prior 15% target.
- Free cash flow outgrew earnings. Cash flow rose 43% to $3.0 billion at above 140% conversion, driven by higher earnings and improved working capital, funding $4.22 billion of buybacks in the quarter.
- Defense contributed a strong book-to-bill. Defense & Propulsion Technologies grew sales 16% and posted a 1.55x book-to-bill ratio across the first half on rising military demand.
- Margin was the cost of growth. Profit margin fell 130 basis points to 21.7% because GE is delivering more installed engines and investing in the GE9X ramp, both of which depress near-term margin while building future aftermarket.
GE Aerospace Q2 2026 Financial and Consensus Profile: Revenue, EPS and Margins
GE's Q2 print showed a company beating on every headline metric while its leading indicator cooled. The tension between a $210 billion backlog and 17% order growth is the entire 2026 debate.
|
Financial Metric |
Consensus Estimate |
Reported / Actual |
Surprise |
|
Q2 2026 Adjusted Revenue |
~$11.87 billion |
$12.6 billion |
Beat by nearly 7%; up 24% year over year |
|
Q2 2026 Adjusted EPS |
~$1.86 |
$2.02 |
Beat by 8.6%; up 22% year over year |
|
Q2 2026 GAAP EPS |
— |
$2.30 |
$2.41 billion from continuing operations, up from $2.01 billion |
|
Q2 2026 Total Orders |
— |
$16.5 billion |
Up 17%, sharply decelerating from 87% in Q1 |
|
Q2 2026 Operating Profit |
— |
$2.7 billion |
Up 18%; margin down 130 basis points to 21.7% |
|
Q2 2026 Free Cash Flow |
— |
$3.0 billion |
Up 43%; conversion above 140% |
|
Q2 2026 Segment Growth |
— |
CES up 27%, DPT up 16% |
Commercial services revenue alone up 26% |
|
FY2026 Adjusted EPS Guidance |
$7.10 to $7.40 prior |
$7.65 to $7.85 |
Raised; roughly 20% above 2025 at the low end |
|
FY2026 Free Cash Flow Guidance |
$8.0 to $8.4 billion prior |
$8.9 to $9.2 billion |
Raised; already exceeds the original 2028 target |
For context, Q1 2026 delivered adjusted EPS of $1.86 against a $1.60 estimate with revenue growth of 29% and orders up 87%, yet GE held guidance unchanged, citing rising oil prices, tightening jet fuel supply and a softening global economy. Culp said at the time that without those events the company would have been raising the guide. Commercial services backlog stands at $170 billion within a total exceeding $210 billion, and management has upgraded full-year commercial services revenue growth to the low 20s.
GE Aerospace (GE) 2026 Investment Outlook: $455 Bull Case vs. $344 Bear Case
GE Aerospace's outlook for the rest of 2026 depends on one central question: whether decelerating order growth signals a cooling cycle or simply normalization against an exceptional Q1 comparison.
The Bull Case: Backlog Visibility and LEAP Growth Push GE Toward $455
The bull case rests on unusually strong revenue visibility. GE is not simply forecasting demand, it is already scheduling much of it. About 95% of third-quarter spare parts revenue is in backlog, while two-thirds of 2026 shop visit engines are already off wing. Management described the current challenge as supply-driven rather than demand-driven, with shop visits oversubscribed by 40% relative to the full-year plan.
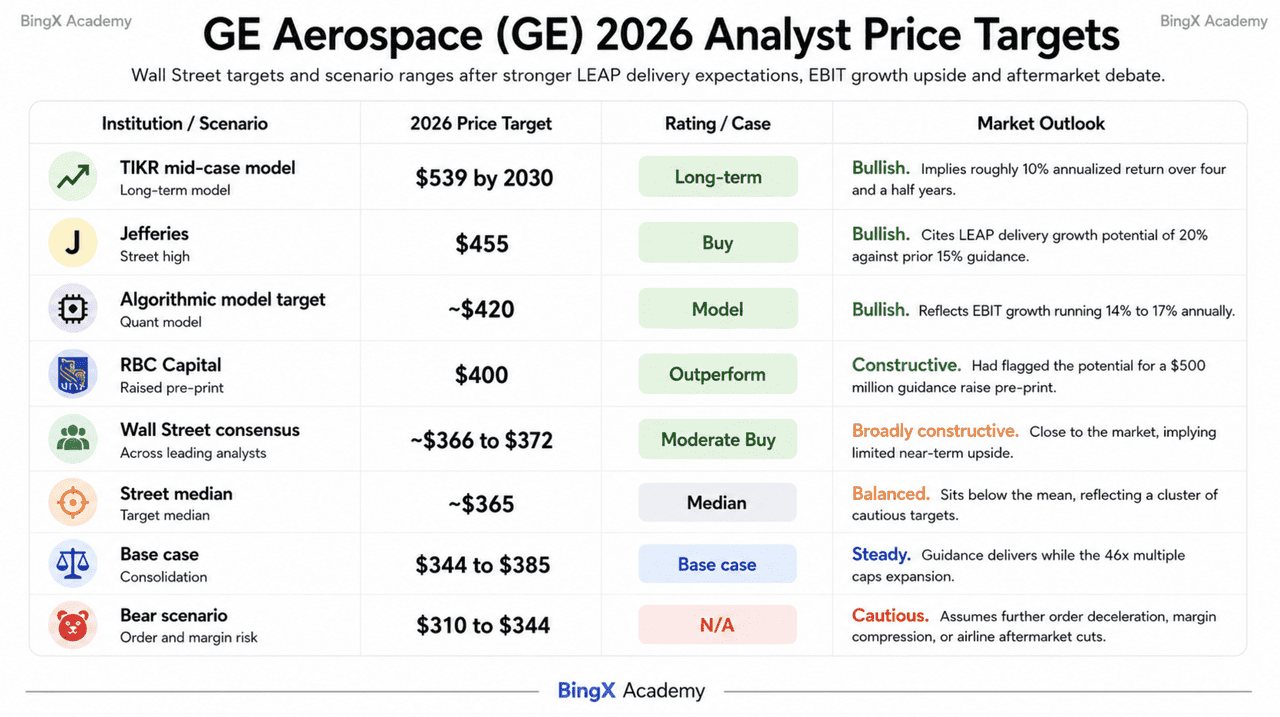
This scenario requires continued supply-chain improvement. FLIGHT DECK has reduced lead times for critical engine parts by 60%, while deeper supplier coordination is easing bottlenecks. Jefferies holds the Street-high target of $455, citing potential LEAP delivery growth of 20% in 2026, while RBC targets $400. Longer term, LEAP services margins are expected to reach parity with the broader services portfolio by 2028. If investors begin valuing GE on aftermarket conversion rather than quarterly order growth, the stock could move toward $400 and then $455.
The Base Case: Raised Guidance and a High Valuation Keep GE Between $344 and $385
In the base case, GE delivers its higher guidance without further multiple expansion. Full-year adjusted EPS lands within $7.65 to $7.85, free cash flow exceeds $8.9 billion, and the stock trades between its 50-day moving average and the $382.97 high while investors wait for stronger orders or wider margins.
The Street consensus already reflects this outcome. Average targets sit near $366 to $372, with the median around $365, only modestly above the market despite another beat-and-raise quarter. Support sits near $344, around the 38.2% Fibonacci level and long-term trendline. Strong free cash flow supports the dividend, but a forward valuation near 46 times earnings limits further upside.
The Bear Case: Slower Orders and Margin Pressure Pull GE Toward $310
The bear case depends on the order cycle continuing to cool. Total order growth slowed from 87% in Q1 to 17% in Q2. Although the comparison was difficult, another slowdown would raise questions about whether the $210 billion backlog is near a peak rather than a durable floor.
The main risk is weaker demand arriving before supply constraints ease. Spare parts delinquencies rose 20% sequentially in Q2, limiting GE’s ability to accelerate backlog conversion, while margins fell 130 basis points due to delivery mix and GE9X investment. With LEAP services margins unlikely to reach portfolio parity until around 2028 and the stock trading near 46 times forward earnings, there is little room for disappointment. A break below $344 could open the path toward the low $300s.
GE Stock Price Forecasts for 2026 By Wall Street Analysts
Wall Street is bullish on the business and cautious on the price. Ratings run roughly 19 Buy to a small number of Holds and Sells across 21 to 22 analysts, yet the mean target sits only modestly above the market, which is itself the clearest statement of the valuation debate.
|
Institution |
2026 Price Target |
Rating |
Market Outlook |
|
TIKR mid-case model |
$539 by 2030 |
Long-term |
Bullish. Implies roughly 10% annualized return over four and a half years. |
|
Jefferies |
$455 |
Buy |
Street high. Cites LEAP delivery growth potential of 20% against prior 15% guidance. |
|
Algorithmic model target |
~$420 |
— |
Bullish. Reflects EBIT growth running 14% to 17% annually. |
|
RBC Capital |
$400 |
Outperform |
Constructive. Had flagged the potential for a $500 million guidance raise pre-print. |
|
Wall Street consensus |
~$366 to $372 |
Moderate Buy |
Broadly constructive but close to the market, implying limited near-term upside. |
|
Street median |
~$365 |
— |
Balanced. Sits below the mean, reflecting a cluster of cautious targets. |
|
Base case |
$344 to $385 |
Consolidation |
Steady. Guidance delivers while the 46x multiple caps expansion. |
|
Bear scenario |
$310 to $344 |
N/A |
Cautious. Assumes further order deceleration, margin compression, or airline aftermarket cuts. |
How to Trade GE Aerospace (GE) Stock on BingX
Navigate the volatility of GE Aerospace's earnings cycle using BingX TradFi and BingX AI tools. By leveraging AI-driven predictive analytics, you can better anticipate market sentiment shifts and price action around quarterly releases.
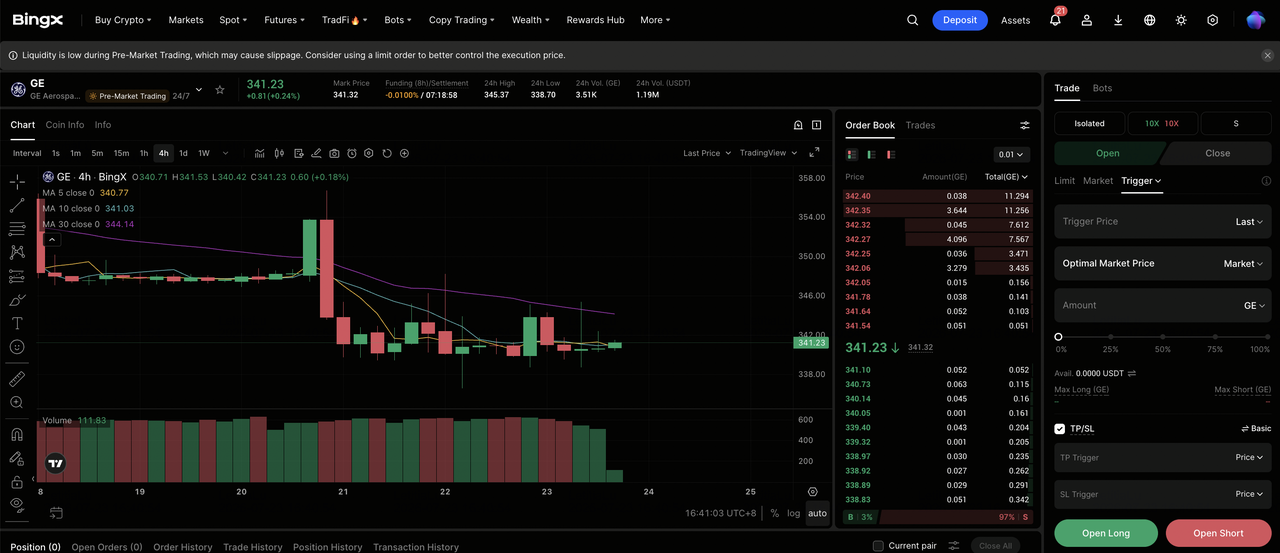
Step 1: Access BingX TradFi. Sign up and navigate to the specialized TradFi section on the main BingX exchange dashboard.
Step 2: Select GE Aerospace (GE). Search for and select the GE-USDT perpetual futures contract.
Step 3: Choose your direction. Select Open Long if you expect the $210 billion backlog to convert on schedule, order growth to reaccelerate against easier comparisons, and LEAP services margins to move toward portfolio parity. Select Open Short if you expect orders to decelerate further, spare parts delinquencies to keep constraining output, or a 46 times forward multiple to compress toward the sector.
Step 4: Select leverage and margin mode. Choose Isolated or Cross-Margin based on your risk tolerance. Because GE has now fallen on three consecutive earnings beats, conservative leverage and clear position sizing are important.
Step 5: Execute strict risk protocols. Set Take-Profit and Stop-Loss (TP/SL) levels before or immediately after entering the trade. GE can react quickly to quarterly earnings, order and backlog disclosures, LEAP delivery updates, jet fuel prices and airline capacity decisions, defense budget headlines, and Boeing and Airbus production rates.
Top 5 Risks to Watch for GE Aerospace Investors in 2026
To navigate the second half of 2026, investors must weigh GE's backlog visibility against these five structural and cyclical headwinds.
- Order growth decelerated from 87% to 17%: Orders are the leading indicator that feeds the backlog the valuation depends on. A further step down would force the market to treat $210 billion as a peak rather than a base.
- The valuation leaves no cushion: At roughly 46 times forward earnings, GE trades at a premium to the S&P 500 and its own history. The stock has now fallen on three consecutive beats, which suggests the bar is set by the multiple rather than the results.
- Supply chain constraints are capping output: Spare parts delinquencies grew 20% sequentially in Q2. With shop visits oversubscribed by 40% relative to guidance, GE cannot convert backlog as fast as demand would allow.
- Margins are compressing on delivery mix: Profit margin fell 130 basis points to 21.7% on higher installed engine volume, GE9X ramp investment and inflation, and LEAP services margins are not expected to reach portfolio parity until around 2028.
- Airline economics remain exposed to fuel and geopolitics: Jet fuel disruption through the Strait of Hormuz pressured airline customers earlier in the year, and aftermarket maintenance spending is among the first budgets airlines defer when costs rise.
Final Thoughts: Should You Invest in GE Aerospace in 2026?
Following its July 16 report, GE Aerospace looks like a highly effective operator trading at a valuation that leaves little room for execution mistakes. Revenue rose 24%, adjusted EPS increased 22% and beat expectations, free cash flow climbed 43% with conversion above 140%, and management raised guidance across every major line. A backlog above $210 billion and 95% visibility into next quarter’s spare parts revenue reinforce the strength of the operating outlook. The main concern is valuation, especially after order growth slowed from 87% in Q1 to 17% in Q2.
The bull case is that GE remains supply-constrained rather than demand-constrained, with FLIGHT DECK gradually easing bottlenecks and LEAP services margins expected to reach portfolio parity by 2028. The bear case is that a forward multiple near 46 times earnings already prices in years of aftermarket growth. Investors confident in the long aviation cycle may view post-earnings pullbacks as opportunities, while more cautious traders may wait for order growth to improve or for the stock to retest support near $344.
Risk Reminder: Trading and investing in equities like GE involves a high risk of capital loss. GE Aerospace is exposed to airline capital spending cycles, supply chain constraints, fuel price shocks and defense budget timing, any of which can move the stock independently of its earnings. Conduct independent research before allocating capital.
Related Reading
- Top Space Stocks to Buy Ahead of SpaceX IPO
- Rocket Lab Stock Forecast 2026: Can RKLB's Space Infrastructure Play Break $150 After Its 400% Run?
- Redwire Price Prediction 2026: Can Space and Defense Momentum Help RDW Extend Its 220% Rally?
- SpaceX (SPCX) Price Prediction 2026: $227 Street-High AI Fusion or Trillion-Dollar Valuation Bubble?
- Firefly Aerospace Stock Outlook 2026: Can Launch Vehicles, Spacecraft Services Drive FLY to $45+?
- AST SpaceMobile Stock Outlook 2026: Can BlueBird, Space-to-Phone Services Drive ASTS to $130+?
