Success in the digital asset space depends on more than just picking the right coin; it requires mastering the timing of market entries and exits. In the highly volatile cryptocurrency market, prices can swing wildly in minutes, making it essential for traders to identify when a move has become overstretched. This is where momentum shifts become critical.
One of the most effective tools for navigating these rapid price movements is the Williams %R indicator. Developed by legendary trader Larry Williams, this momentum oscillator is specifically designed to highlight overbought and oversold conditions. By alerting traders to potential exhaustion in buying or selling pressure, Williams %R acts as a sophisticated early-warning system for crypto trading.
Whether you are a day trader looking for quick scalps or a swing trader aiming for longer-term reversals, understanding how to read these momentum signals can transform how you structure your trades.
What Is the Williams %R Momentum Oscillator?
The Williams Percent Range, commonly referred to as Williams %R, is a fast-reacting momentum oscillator. Unlike trend-following indicators that look at price directions, the %R measures the closing price of an asset relative to its highest price and lowest prices over a specific lookback period.
The Core Concept
The indicator evaluates where the current price sits within its recent range. It tells you, at a glance, how close the market is to its recent ceiling or floor.
• Scale: The indicator is plotted on a fixed scale ranging from 0 to -100.
• Lookback Period: The default lookback period is typically 14 periods (days, hours, or minutes, depending on your chart).
• The "Inverse" Logic: Because it is designed to show the distance from the top, the values are negative. A reading of 0 means the price is at the very top of the high-low range, while -100 means it is at the very bottom.
How to Calculate Williams %R
You don't need to be a mathematician to use it. The formula essentially calculates:
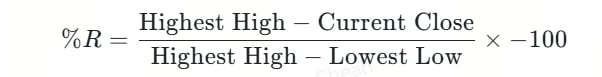
This simple calculation ensures the indicator stays highly sensitive to sudden changes in market sentiment, making it a favorite for the fast-moving crypto markets.
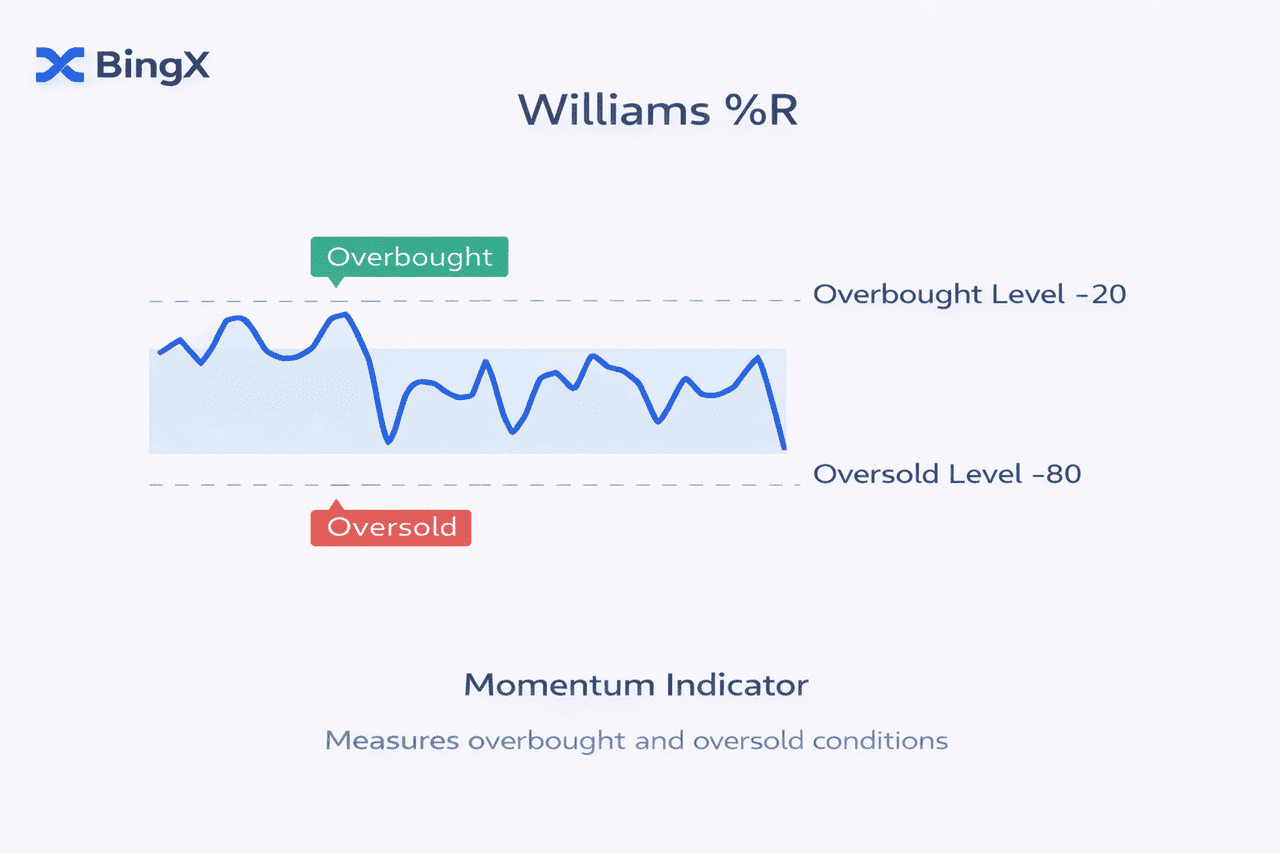
How Does Williams %R Identify Overbought and Oversold Levels?
The primary function of the Williams %R is to define the boundaries of market extremes. By categorizing price movement into specific zones, it helps traders visualize when a crypto trading pair is stretched too far in one direction.
The Overbought Zone (0 to -20)
When the indicator rises above -20, the asset is entering the overbought zone.
• Overbought Market: This suggests the closing price is near the top of its recent range.
• Potential Price Correction: Overbought conditions indicate that buying momentum may be slowing, signaling a potential pullback or momentum shifts to the downside.
• R Readings: A reading near 0 shows the asset is trading at the absolute highest point of its lookback period.
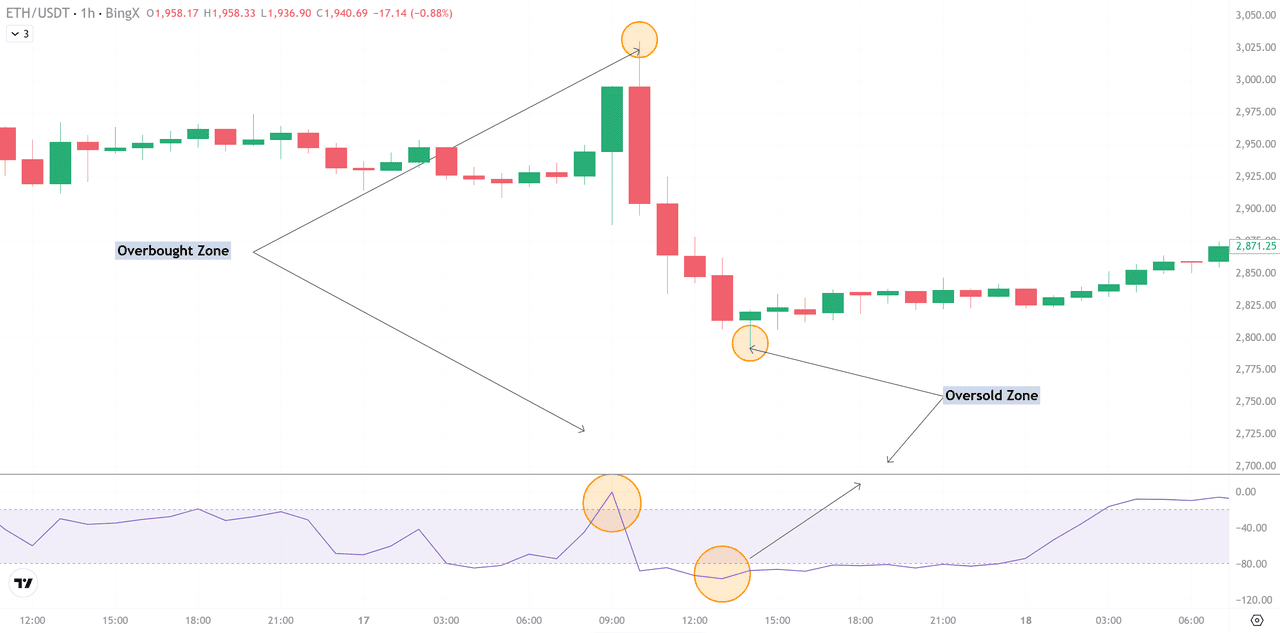
Ethereum (ETH/USDT) Price Chart - Source: BingX
The Oversold Zone (-80 to -100)
When the indicator falls below -80, the asset has entered the oversold zone.
• Oversold Market Conditions: This reflects that the price is trading near the bottom of its high-low range.
• Oversold Signals: Traders view an oversold reading as a sign that selling pressure might be exhausted, often preceding a bounce or trend reversal.
Important Distinction: Momentum vs. Execution
It is vital to understand that an overbought or oversold reading is not an immediate "buy" or "sell" command.
• Overbought does not mean immediate sell: In a strong bull market, cryptocurrency can remain in the overbought zone for an extended period while prices continue to climb.
• Oversold does not mean automatic buy: Conversely, during a crash, an asset can stay considered oversold while the underlying market price continues to drop.
Instead of viewing these levels as definitive exit or entry and exit points, traders should use them to identify momentum shifts that require further confirmation from price action or other technical indicators.
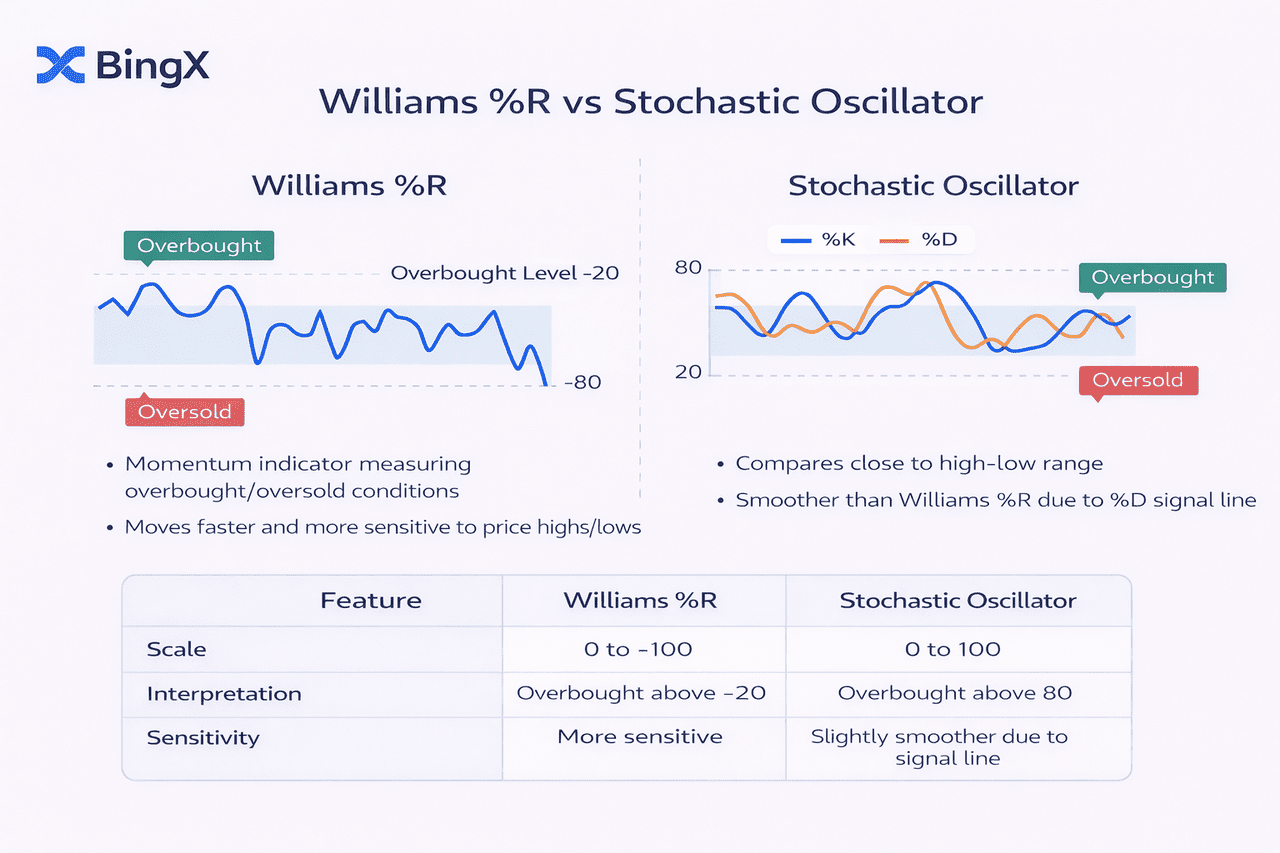
Williams %R vs. Fast Stochastic Oscillator
To the untrained eye, Williams %R and the Fast Stochastic Oscillator look almost identical. Both are momentum oscillators used in technical analysis tools to identify overbought and oversold conditions. However, subtle differences in their calculation and presentation can affect how short-term traders use them.
Key Similarities and Differences
• Calculation Method: Both indicators use the highest price and lowest prices over a defined lookback period to measure momentum.
• The Scale: The Stochastic Oscillator is plotted on a scale of 0 to 100, while Williams %R uses a scale of 0 to -100.
• Sensitivity: Williams %R is known to react slightly differently because it does not use the internal smoothing (moving averages) found in the Full or Slow Stochastic. This makes it a very "raw" and responsive indicator for momentum shifts.
Which One Should You Use?
Traders often prefer Williams %R over the fast stochastic oscillator when they need a more sensitive lead on price movement. While both serve as reliable technical indicators for your trading system, the %R is particularly effective at highlighting the exact point where the price reaches the top or bottom of its high low range.
How to Use Williams %R in Crypto Trading: Step-by-Step
Mastering Williams %R requires a blend of technical readings and disciplined trading strategies. By following these steps, intraday trading enthusiasts and swing traders can better navigate volatile markets.
Step 1: Identify Market Conditions
Before looking at the oscillator, determine if the market is trending or sideways. Williams %R is a powerful technical analysis tool in sideways markets (range-bound), where prices bounce between established floors and ceilings. Be cautious during strong trends, as the indicator can remain in extreme zones for an extended period.
Step 2: Spot Overbought or Oversold Reading
Monitor the indicator as it moves into the "danger zones."
• An overbought reading occurs above -20.
• An oversold reading occurs below -80.
Step 3: Confirm With Price Action
Never trade the indicator in isolation. Combine the %R signal with:
• Candlestick patterns (like the Inverted Hammer).
• Support and resistance levels.
• Moving averages crossovers.
Step 4: Define Entry and Exit Points
• Long Position: Look for an oversold reading at a key support level, confirmed by a bullish candle.
• Short Position: Look for an overbought reading at resistance, confirmed by bearish price action.
How to Trade Using Williams %R?
Here are some scenarios to illustrate how to use the Williams %R indicator in trading crypto:
Strategy 1: The Overbought Reversal (Bearish Setup)
This strategy targets potential reversal points when momentum is exhausted. Using the ETH/USDT chart as a reference, we see a Double Top at Resistance combined with an overbought Williams %R reading.
• The Setup: Price hits a resistance zone while the %R is above -20.
• Entry (Sell Zone): Enter a short position when price action confirms the reversal. For example, the entry is at $2,961.
• Stop Loss: Placed above the recent swing high at $3,124.
• Exit Point: Take profit when the indicator reaches the oversold zone, near $2,385.
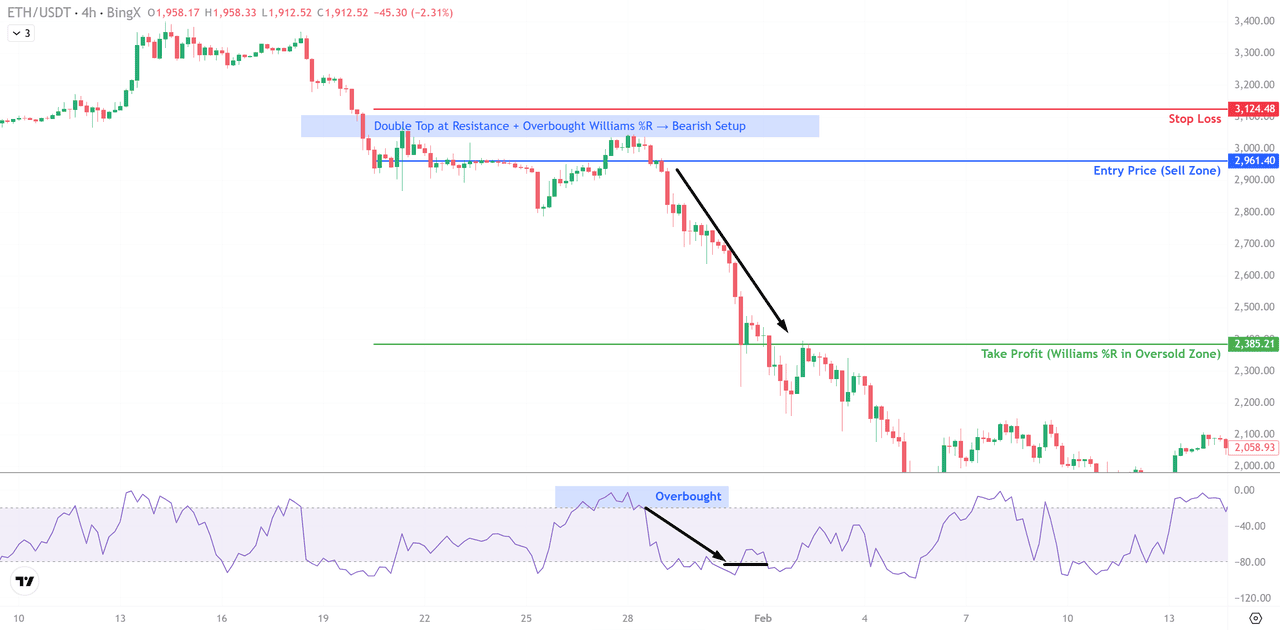
Ethereum (ETH/USDT) Price Chart - Source: BingX
Strategy 1: The Oversold Reversal (Bullish Setup)
This strategy focuses on identifying high-probability entries when a cryptocurrency is undervalued and ready to bounce. The ETH/USDT 4H chart provides a perfect example of an oversold reversal in action.
The Setup
The Williams %R drops below -80, indicating that the asset is trading near the bottom of its recent range. In the screenshot, Ethereum enters the blue Oversold Zone near the 2,870 level. The price action reaches a local floor, and selling pressure begins to fade.
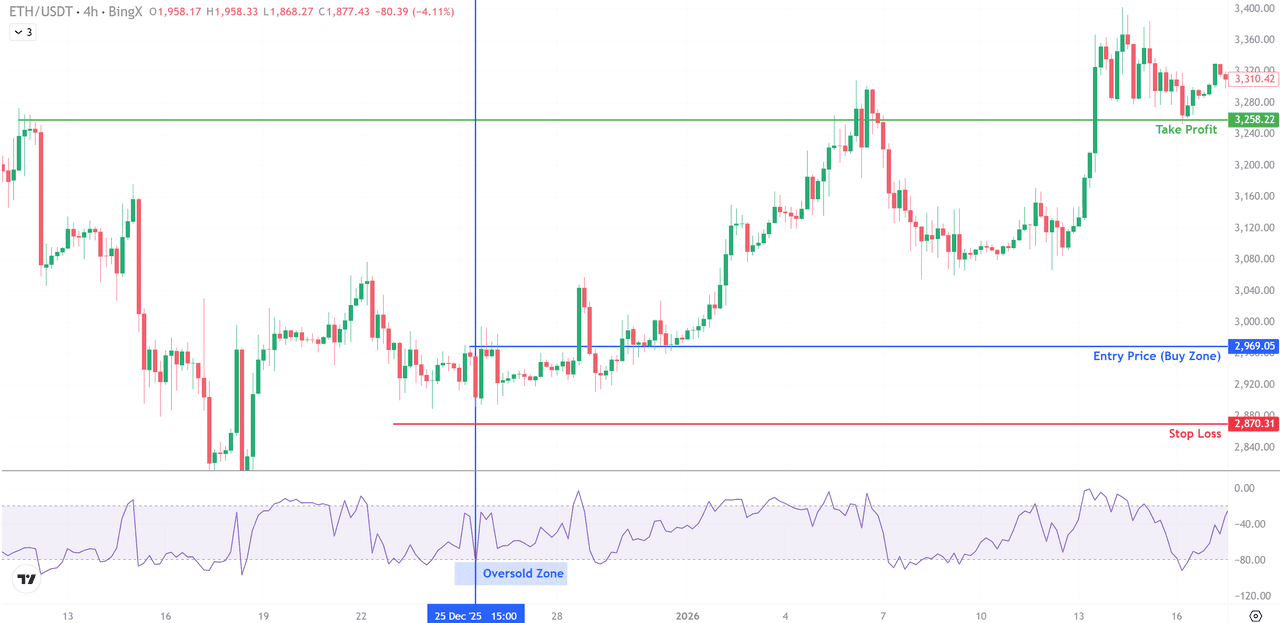
Ethereum (ETH/USDT) Price Chart - Source: BingX
The Execution
• Entry (Buy Zone): Traders enter a long position once the %R climbs back above -80. On your chart, this "Buy Zone" trigger is set at 2,969.
• Stop Loss: To manage risk, place a stop loss below the recent swing low, marked here at 2,870.
• Take Profit: Target the next major resistance or exit when the %R reaches the overbought zone (-20). The target in this example is 3,258.
Strategy 2: Trend Confirmation
In a current trend, only take signals that align with the broader direction.
• In an uptrend, only buy oversold signals (dips).
• In a downtrend, only sell overbought signals (relief rallies). This reduces false signals by ensuring you aren't trading against the dominant market force.
Strategy 3: Breakout Filter
Use the Williams %R to avoid buying the top. If a coin is breaking out but the %R has been pinned at 0 for an extended time, the move may be overextended. A successful trading system uses this as a filter to wait for a retracement before entering a long position.
Common Mistakes Traders Make When Trading Williams %R
Despite its precision, misinterpreting Williams %R can lead to costly errors. Many traders fail by ignoring the market conditions or the underlying market price action.
• Premature Execution: Selling immediately at an overbought reading or buying at oversold is a trap.() In strong trends, the indicator can stay at these extremes for an extended period while prices continue to climb or fall.
• Isolation Bias: Using Williams %R without other indicators like moving averages or volume often results in false signals.
• Ignoring Context: The indicator thrives in sideways markets but struggles with powerful trends without price confirmation.
Risk Management When Using Williams %R
To master Williams %R, you must prioritize risk management. Always define your stop-loss based on a recent swing high or low to protect against volatility.
Stick to risking only 1–2% per trade and avoid overleveraging. By combining this tool with price action and broader technical analysis, you can secure reliable exit points and prevent technical indicators from providing isolated, risky signals.
Advantages and Limitations of Williams %R
Understanding both the strengths and weaknesses of the Williams %R is essential for any trading system. While it is a highly responsive momentum oscillator, it requires careful application depending on market conditions.
Advantages
• Simple Momentum Indicator: The %R is easy to read and provides an immediate snapshot of where the closing price sits relative to the recent range.
• Clear Overbought and Oversold Levels: The fixed -20 and -80 levels provide objective zones for identifying overbought and oversold conditions.
• Works Well in Range Markets: In sideways markets, the %R is exceptionally accurate at pinpointing potential reversal points at the edges of the high low range.
Limitations
• False Signals in Strong Trends: The indicator often generates false signals when a market is trending aggressively, as it lacks a smoothing component.
• Extended Extremes: A cryptocurrency can stay in the overbought zone or oversold zone for an extended period, leading to premature entries.
• Needs Confirmation: To be effective, it must be paired with other technical indicators or price action to validate a trend reversal.
Conclusion: How to Use Williams %R to Turn Momentum Into Structured Trades
Williams %R is a vital tool for identifying overbought and oversold conditions, but its true power lies in confirmation. By combining this oscillator with moving averages and price action, you can transform raw momentum into high-probability trading strategies. Always maintain disciplined risk management to navigate the volatility of crypto trading.
Ready to master momentum? Start trading with precision on BingX today and leverage professional-grade tools for your portfolio.
Related Reading
4. Simple Moving Average(SMA) vs Exponential Moving Average(EMA) in Crypto Trading: Differences to Know
FAQs on Trading with Williams %R
1. Is Williams %R good for crypto trading?
Yes, it is a highly effective momentum oscillator for crypto trading because it reacts quickly to the market's extreme volatility. It is particularly strong in sideways markets for identifying potential reversal points.
2. What is an overbought or oversold reading on Williams %R?
A reading between 0 and -20 is considered the overbought zone, while a reading between -80 and -100 is the oversold zone. These levels indicate that the closing price is at the extreme edge of its recent range.
3. Does overbought mean I should sell immediately?
No. In strong bull runs, an asset can remain in the overbought zone for an extended period while the price increase continues. Always wait for price action confirmation before entering a short position.
4. What is the best lookback period for Williams %R?
The default lookback period is 14 periods. However, day traders may use a shorter period for higher sensitivity, while swing traders often prefer the default setting on daily charts for more reliable signals.
5. How is Williams %R different from the Stochastic Oscillator?
While both measure overbought and oversold conditions, Williams %R is an unsmoothed version that reflects raw momentum relative to the high low range. It is often more responsive to sudden price movements than the fast stochastic oscillator.