

In late June 2026, AMC Entertainment Holdings Inc. (NYSE: AMC) sits at a familiar yet critical crossroads, caught between rapidly improving core operational metrics and a highly dilutive corporate financing strategy. Following a steep 23% single-day crash on June 24, 2026, the retail favorite is trading near $2.00, demonstrating the intense volatility that continues to define this veteran meme asset.
While long-term investors have been heavily penalized by historical reverse splits and persistent capital raises, the structural setup for the remainder of 2026 is fundamentally changing. Traders are aggressively weighing an exceptionally strong first-quarter report, which delivered AMC’s best adjusted EBITDA in seven years, against back-to-back equity offerings that have dumped over 200 million new shares onto the market in less than 30 days.
As the theatrical industry enters a powerful summer blockbuster slate with domestic ticket sales and concession spending tracking at pre-pandemic multi-year highs, the fundamental justification for an AMC turnaround has never been stronger. However, a heavily leveraged balance sheet and a deeply negative equity position mean the threat of structural dilution remains an ongoing valuation overhang.
This guide breaks down the AMC stock forecast and price prediction for the remainder of 2026, utilizing data from B. Riley, Roth MKM, S&P Global Market Intelligence, consensus Wall Street price targets, and official SEC regulatory disclosures.
You will also discover how to trade AMC Entertainment (AMC) stock futures on BingX TradFi with USDT collateral.
Top 5 Things for AMC Entertainment (AMC) Traders to Know in 2026
As AMC navigates a high-stakes environment of debt clearance and aggressive equity dilution, active traders must closely monitor these five key market-moving factors:
- The $200M June Institutional Direct Offering: On June 24, 2026, AMC executed a definitive agreement to sell 95,250,000 shares of common stock at a steep discount price of $2.10 per share directly to institutional buyers. This deal carries a mandatory 45-day lock-up period restricting further equity issuance.
- Clearing the 2027 Debt Runway: Management is utilizing the $189 million net proceeds from the June direct sale to fully redeem $125.5 million of its 6.125% Senior Subordinated Notes due 2027. This aggressive move completely eliminates AMC's sole remaining near-term maturity threat ahead of 2029.
- The $150M ATM Offering Dilution: Immediately preceding the institutional direct placement, AMC fully completed an at-the-market (ATM) equity program in early June, issuing 105.3 million new shares to build cash reserves. This brings total fresh dilution to over 200 million shares in June alone.
- Post-Pandemic Box Office Recovery: Driven by major theatrical releases, AMC welcomed 25.5 million guests in May 2026, registering its highest-attended month of May since 2019.
- The Per-Patron Inflation Tailwind: AMC's top-line revenues are heavily buoyed by aggressive pricing power. Q1 2026 numbers reveal an average ticket price of $12.15, up 29% from 2016, and record food/beverage spending of $7.29 per patron, up 53% from 2016.
What Is AMC Entertainment (AMC)?
AMC Entertainment Holdings, Inc. (NYSE: AMC) is the largest movie exhibition company in the world, operating more than 1,000 theaters and over 11,000 screens across North America and select European markets. Founded in 1920, the company premiumized modern theatrical infrastructure by widely deploying IMAX®, Dolby Cinema™, and RealD 3D viewing formats.
In the modern financial landscape, AMC represents the quintessential 'battleground stock.' Following its transformation into a high-retail-interest meme stock during the 2021 market cycle, management has actively used high trading volumes to repeatedly issue equity. Today, under the leadership of CEO Adam Aron, the firm functions as an operational turnaround project, aggressively scaling its high-margin food and beverage ecosystem while working to systematically restructure its massive pandemic-era corporate debt load.
AMC's Performance in Early 2026: The Liquidity vs. Dilution Tug-of-War
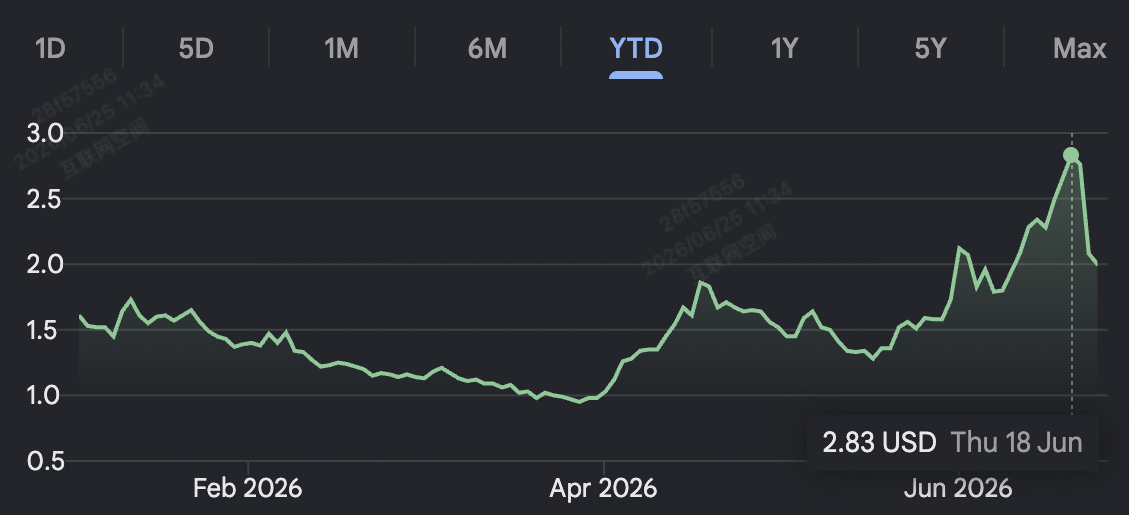
AMC stock YTD performance as of June 2026 | Source: Google Finance
AMC entered 2026 experiencing a major operational resurgence. On May 5, 2026, the company reported outstanding financial results for the first quarter. Total revenues climbed to $1.045 billion, a robust expansion over the $862.5 million reported in Q1 2025. More importantly, adjusted EBITDA swung aggressively into positive territory at $38.3 million, marking an absolute $96 million improvement year-over-year.
Despite this operational momentum, the underlying balance sheet continues to act as a significant drag. Trailing twelve-month (TTM) cash interest payments hit $476.7 million, vastly outstripping the firm's $126.6 million in GAAP operating income. Consequently, AMC recorded a net loss of $117.1 million for Q1 2026 and posted a negative operating cash flow of -$128.5 million.
To counter this persistent cash burn, management deployed consecutive equity offerings. While these share sales successfully extended the company's financial survival runway and triggered open-market insider buying, such as CEO Adam Aron personally purchasing 250,000 shares at a weighted average price of $1.38 on May 19, 2026, they have dramatically expanded the available float. This constant influx of new equity has placed a hard structural lid on the stock's per-share math, capping consecutive rallies in the high $2.00s and forcing a sharp retracement back to the $2.00 structural baseline.
AMC's 2026 Trading Strategy: How to Navigate Meme Stock Volatility
Successfully trading an asset with a massive retail float and an active corporate issuance desk requires abandoning buy-and-hold complacency. Traders should instead anchor their setups to strict technical floors and volume dynamics:
The $1.90 - $2.10 Support Consolidation
Technical analysts view the current $1.90 to $2.10 window as a critical structural consolidation zone. This region aligns directly with the recent institutional purchase price of $2.10. As long as the stock maintains this zone on weekly candle closes, the market is successfully absorbing the June dilution, setting up a potential technical baseline for active swing traders.
Capitalizing on Momentum-and-Fade Cycles
AMC exhibits classic battleground behavior, characterized by sharp pre-market spikes toward the $2.50 to $2.90 resistance lines followed by fast intraday fades. Momentum traders can map out short-term setups by waiting for high-volume breakout failures at key psychological resistances and capitalizing on mean-reversion pullbacks via tight risk stop-losses.
Evaluating the Altmann Z-Score Distressed Zone
With an Altman Z-Score tracking at a deeply distressed -1.04 and a negative book value of -$3.69 per share, long-term spot exposure carries structural risk. Positions must be sized defensively, treating the asset as a highly liquid short-term trading vehicle powered by short interest covering rather than a stable value investment.
AMC 2026 Stock Forecast: $4.00 Bull Target Peak vs. $1.20 Structural Floor
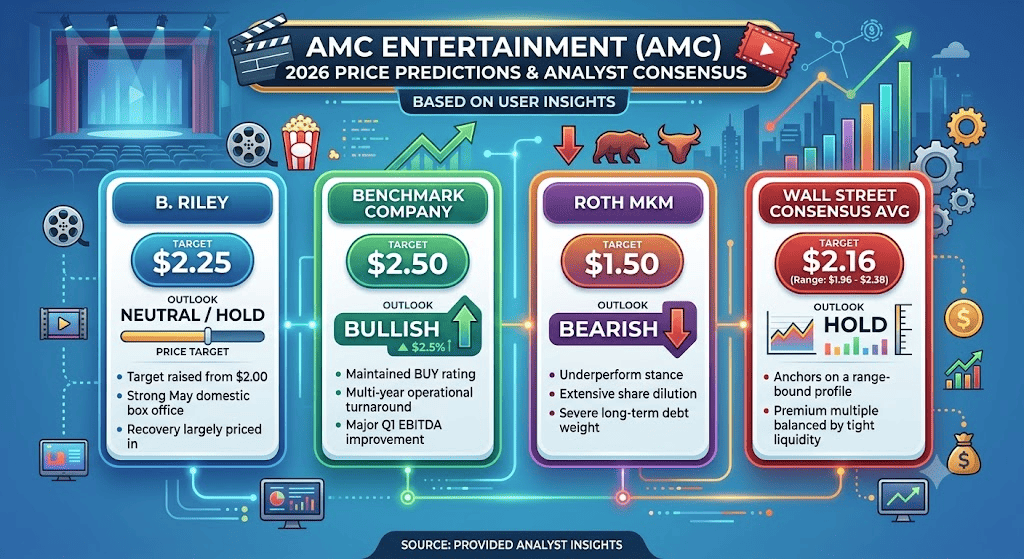
AMC stock price predictions for 2026 by Wall Street analysts
Evaluating AMC's forward trajectory for the remainder of 2026 requires balancing a rapidly recovering box office calendar against a severely stretched capital structure.
AMC's Bull Case: The $3.00 – $4.00 Blockbuster and Debt Compression Rally
The bullish thesis assumes Hollywood maintains its powerful 2026 release cadence through the second half of the year. Backed by price targets from optimistic Wall Street analysts pointing toward $3.00 and $4.00, this scenario relies on massive high-margin concession inflows to accelerate organic EBITDA generation.
As revenue scales toward the full-year forecast of $5.44 billion, the massive operational leverage inherent to movie theaters takes over. If AMC can use its newly raised cash reserves to continuously repurchase its remaining $7.34 billion long-term debt at a steep market discount, it will rapidly compress its annual interest obligations. This operational de-risking, combined with any sudden retail-driven short squeeze against heavily positioned short-sellers, could easily propel the stock out of penny territory to test its 52-week high of $3.60 and peak near $4.00.
The Base Case for AMC Stock: $1.90 – $2.50 Range-Bound Plateau
The base case envisions a prolonged consolidation phase where the market systematically matches AMC's expanding top-line revenue against its massive share float. Under this framework, full-year revenues remain firmly on track to expand 12% year-over-year.
However, because the company must navigate an outstanding float that has been heavily diluted by June's 200 million share issuance, upside price action faces a strict per-share math cap. Wall Street's consensus average price target sits firmly between $1.96 and $2.38. For market participants, this sets up a highly predictable, range-bound trading channel between $1.90 and $2.50, where blockbuster-driven box office spikes are routinely absorbed by the market's expanded float.
AMC Entertainment's Bear Case: The $1.20 Macro Cash Burn and Dilution Trap
The bearish outlook focuses on structural cash burn and the resumption of equity dilution. If consumer spending cools or high gas prices pressure discretionary entertainment habits, AMC's ticket and food revenue trends will stagnate.
Once the mandatory 45-day equity restriction expires, a failure to generate positive operational cash flow would force management to re-open their shelf registration statements, triggering yet another wave of dilutive share offerings. If the stock breaches the vital $1.90 support line, institutional demand will completely evaporate. This would expose the stock to a severe liquidation down-trend, driving valuation back toward the single-analyst low target of $1.20 or its historical 52-week low of $0.93.
AMC Entertainment (AMC) Price Predictions for 2026 by Wall Street Analysts
|
Institution / Source |
2026 Price Target (Peak/Avg) |
Overall Market Outlook |
|
B. Riley |
$2.25 |
Neutral / Hold: Raised target from $2.00 on strong May domestic box office; notes recovery is largely priced into current valuations. |
|
Benchmark Company |
$2.50 |
Bullish: Maintained Buy rating; highlights multi-year operational turnaround and major Q1 EBITDA improvement. |
|
Roth MKM |
$1.50 |
Bearish: Maintains an underperform stance; flags extensive share dilution and severe long-term debt weight. |
|
Wall Street Consensus Avg |
$2.16 (Range: $1.96 – $2.38) |
Hold: Consensus view anchors on a range-bound profile; premium multiple is balanced by tight liquidity constraints. |
How to Trade AMC Entertainment (AMC) Stock Futures on BingX TradFi
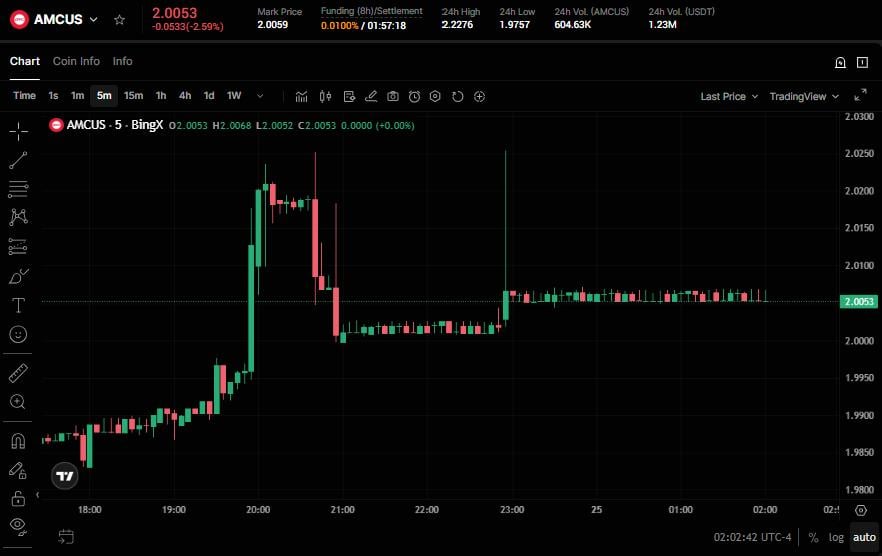
AMCUS/USDT perpetual contract on BingX TradFi
As AMC enters this high-stakes period of debt reduction and extreme price discovery, tactical traders can capitalize on its daily price swings through the BingX platform.
- Access BingX TradFi: Navigate to the specialized TradFi section on the main BingX exchange dashboard.
- Select AMC Entertainment (AMC): Search for and select the AMC-USDT perpetual futures contract.
- Choose Your Direction: Select Open Long if you believe the clearing of the 2027 debt maturity and accelerating summer box office volume will drive the asset toward its $4.00 bullish target. Select Open Short to capitalize on heavy share dilution and negative operating cash flow pullbacks toward the $1.20 floor.
- Select Leverage and Margin Mode: Apply your preferred Isolated or Cross-Margin parameters alongside conservative leverage to optimize your capital efficiency.
- Execute Strict Risk Protocols: Utilize advanced BingX Take-Profit and Stop-Loss (TP/SL)l tools to lock in gains and protect your trading capital from sudden intraday gaps.
Top 5 Risks to Consider Before Investing in AMC Entertainment Stock
While AMC's operational recovery presents a highly liquid trading environment, navigating this stock demands an objective assessment of its deep fundamental challenges:
- Heavy Structural Dilution: Consecutive capital raises significantly reduce the fractional ownership slice of each share, forcing the market to discount the stock's long-term per-share value.
- Severe Interest Expense Overhang: With annual interest obligations of $476.7 million completely eclipsing operating profits, the company remains highly dependent on external capital markets to stay afloat.
- Tight Liquidity Profiles: A Current Ratio and Quick Ratio of 0.35 mean the company possesses very little short-term financial breathing room, leaving it vulnerable to macro shocks.
- Discretionary Spending Dependencies: Entertainment consumption is highly elastic; persistent macroeconomic inflation can cause consumers to rapidly cut movie theater outings from their personal budgets.
- Negative Intrinsic Book Value: Trading with a negative book value of -$3.69 per share implies that under a worst-case liquidation event, there are zero net tangible assets backing common equity holders.
Final Thoughts: Is AMC Entertainment (AMC) a Buy in 2026?
As of late June 2026, AMC Entertainment represents an elite short-term volatility machine rather than a stable long-term portfolio anchor. Fundamentally, management’s ability to clear near-term maturities and post positive adjusted EBITDA proves the core theater business is highly resilient and structurally recovering.
However, trading an asset undergoing active multi-million share dilution cycles demands supreme execution discipline. For tactical short-term traders, AMC provides an ideal setup for rapid percentage gains via BingX futures contracts. Conversely, market participants focused on long-term capital preservation should avoid chasing macro breakouts, ensuring that any exposure is strictly managed with tight trailing stop-losses.
Risk Reminder: Trading highly shorted consumer-facing equities involves extreme capital risk due to elevated beta metrics, structural leverage, and sudden corporate equity distributions. Always enforce disciplined risk protocols, proper position sizing, and non-negotiable stop-losses.
Related Reading
- Ford Stock Price Prediction 2026: $20 Data Center Battery Boom or Legacy Recall Trap?
- S&P 500 Forecast 2026: 7,600 Bull Run or a 6,000 Energy-Driven Crash?
- Nasdaq 100 (NAS100) Forecast 2026: 27,000 AI Breakthrough or 22,000 Stagflation Trap?
- Top Energy Stocks and ETFs to Buy in 2026: The AI Power Crunch Meets Geopolitical Volatility
- Top 10 Quantum Computing Stocks to Watch in 2026: Companies Driving Next-Gen Computation
